
Sales Forecasting Methodology: Top Methods Explained
Master your sales forecasting methodology. Explore top methods, from qualitative to AI-driven. Learn to choose and implement the best for your business.
You’re probably looking at a forecast right now that feels far cleaner than the truth in your pipeline.
A few deals are marked as likely. A rep says one big opportunity is “nearly there”. Finance wants confidence. You want something simpler: a number you can reliably use to plan hiring, stock, spend, and your next month without getting blindsided.
That’s where most sales forecasting breaks down. Not because forecasting is impossible, but because many teams use a method that doesn’t fit their size, data, or market. That problem is worse in the UK, where most advice still assumes an enterprise RevOps team, a data science bench, and pristine CRM hygiene. In practice, most businesses don’t have any of that. ONS data shows 99.3% of UK businesses are SMEs, which is exactly why enterprise-style forecasting advice often misses the mark for the people who need it most (Forecastio on sales forecasting methods).
A good sales forecasting methodology isn’t about finding the fanciest model. It’s about choosing the method your business can support, then running it consistently enough that the forecast becomes operational, not ceremonial.
Table of Contents
- Beyond the Crystal Ball Why Your Sales Forecast is Wrong
- The Four Pillars of Sales Forecasting
- Comparing Key Sales Forecasting Methodologies
- How to Choose the Right Forecasting Methodology
- Measuring Success Key Forecasting Metrics and KPIs
- Common Forecasting Pitfalls and How to Avoid Them
- Automating Your Forecasts with AI and Zenfox
Beyond the Crystal Ball Why Your Sales Forecast is Wrong
Friday afternoon. The month ends in three days. A founder opens the CRM, the spreadsheet, and the bank balance, then realises all three tell a different story.
That gap is the primary forecasting problem for solo operators and SMEs. The issue is rarely effort. It is using a method that does not match the sales motion, relying on stale manual updates, and treating rep confidence as evidence.

The problem isn’t forecasting. It’s fit
Smaller UK teams are often told forecasting gets serious only once they have analysts, a BI stack, and years of clean data. That advice is dated and not very useful.
A solo consultant with ten live opportunities does not need the same forecasting setup as a national retailer. A small SaaS team with a decent CRM history should not run the business on gut feel. A growing agency should stop treating a spreadsheet roll-up as reliable just because everyone knows how to edit it.
The method has to fit the business. That sounds obvious, but it is where forecasts usually go wrong.
I have seen founders commit hiring plans off a pipeline that was two weeks out of date. I have seen sales teams call deals "likely" because the client sounded positive, while procurement had not even started. I have also seen small teams produce surprisingly accurate forecasts once they cleaned up stage rules, review cadence, and data capture.
Why smaller teams get forecasting wrong
The failure points are usually clear:
- The method does not match the data. Stage weighting breaks down when stages mean different things to different people.
- Judgement carries too much weight. Forecast reviews turn into rep narratives instead of evidence-based calls.
- Market changes never make it into the model. Price pressure, slower approvals, or seasonal slowdowns show up late.
- Updates depend on manual discipline. By the time the number reaches the founder or finance lead, it is already stale.
Practical rule: If your forecast depends on everyone remembering to update it manually, it is not a forecasting system. It is a fragile ritual.
There is also an operating issue underneath all this. Forecast quality depends on process quality. If lead stages, follow-up tasks, and handoffs are inconsistent, the forecast will be inconsistent too. Teams that want a more reliable number usually need tighter process control first, which is why a clear workflow management system for small teams matters long before anyone starts talking about AI.
Weighted pipeline forecasting is still useful. It gives teams a fast way to turn pipeline into a working revenue view. The mistake is treating it as the answer on its own. It should be one input among several, especially for UK SMEs with uneven deal sizes, founder-led selling, and limited ops support.
That is where modern no-code automation changes the picture. Smaller teams no longer need a data science function to improve forecast quality. Tools like Zenfox can pull data from the CRM, apply rules consistently, flag stale deals, and keep the forecast current without adding admin work. For solo professionals and SMEs, that is the difference between a forecast that helps decisions and one that creates false confidence.
The Four Pillars of Sales Forecasting
Most forecasting methods look confusing because people learn them as a long list. It’s easier to work with a smaller frame.
In practice, nearly every sales forecasting methodology sits on four pillars: judgement, time-based patterns, causal analysis, and pipeline logic. Once you understand those, the methods stop feeling abstract.
Qualitative judgement
This is the oldest form of forecasting. You ask experienced people what they think will close, slip, or stall.
Used well, it helps when you’re launching a new service, entering a market with little history, or selling high-trust work where the relationship matters as much as the process. Used badly, it becomes optimism with better formatting.
The strength is context. The weakness is bias.
Time-based patterns
This pillar asks a simple question. What does the past, arranged over time, tell us about the future?
Retail teams use this naturally. Subscription businesses do too. If your sales move in recurring patterns, time-based methods can spot trend and seasonality more reliably than rep opinion can.
That’s one reason operational discipline matters so much. A messy process usually creates messy timestamps, and messy timestamps weaken the forecast. Teams that want better visibility often need cleaner process design first, which is also why workflow structure matters in day-to-day execution. A useful primer on that sits in Zenfox’s guide to a workflow management system.
Causal models
Causal forecasting goes beyond “what happened before” and asks “what drives results”.
That might mean leads, conversion rate, deal size, sales cycle length, ad spend, or macro signals. Regression models apply to such data. They’re especially useful when the market is shifting and historical trend alone is too blunt.
Good causal models don’t try to explain everything. They focus on the few variables that consistently move the result.
Pipeline forecasting
This is the one most sales teams know. You look at open opportunities, assign probabilities, and estimate what’s likely to close in a given period.
It’s practical because it connects directly to active deals. It’s also dangerous because teams often confuse stage with certainty. A deal in proposal isn’t necessarily healthy. It may be parked there.
Here’s the simplest way to think about the four pillars:
| Pillar | Best use | Main risk |
|---|---|---|
| Qualitative | New offers, limited data, founder-led selling | Bias |
| Time series | Repeating demand patterns | Breaks in volatile conditions |
| Causal | Markets shaped by clear drivers | Needs cleaner data |
| Pipeline | Active deal forecasting | Stage inflation |
A mature forecast usually combines pillars. Small teams don’t need all of them on day one, but they do need to know which pillar they’re standing on. That alone improves decision quality.
Comparing Key Sales Forecasting Methodologies
A Bristol agency owner and a regional retailer should not use the same forecasting method. One may have twenty live deals and founder-led sales calls. The other may have years of weekly transaction data. The method has to match the sales motion, the quality of the data, and the cost of being wrong.
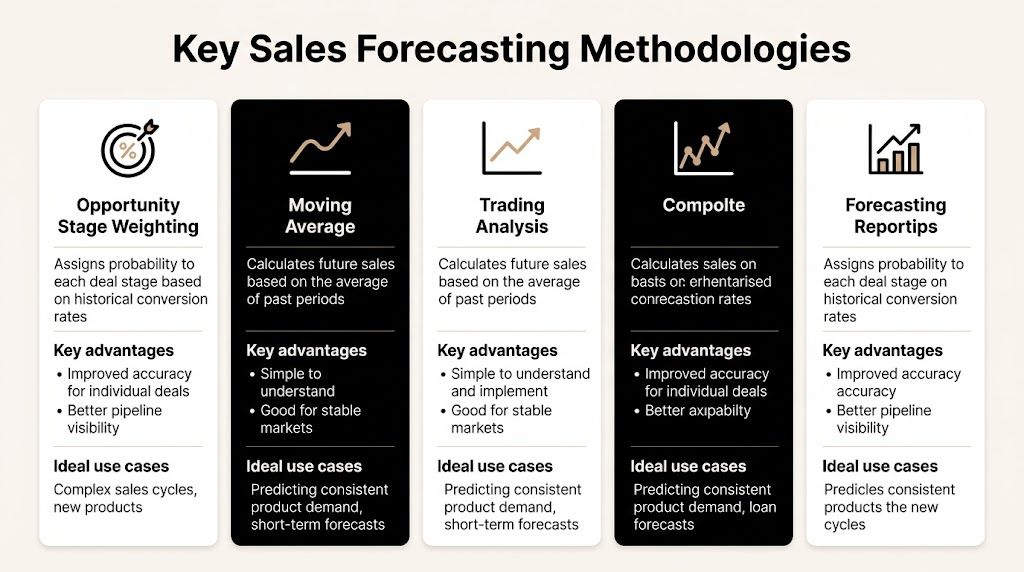
For solo professionals and UK SMEs, this matters more than the textbook debate. Small teams rarely have an analyst, a BI stack, and a clean warehouse of historical data. They still need a forecast they can act on. That usually means starting with a method that is simple enough to run every week, then adding automation as the business gets more data.
Moving average
Moving average is the baseline method I would use first for a stable business with repeat purchases. It averages sales across a set number of periods so one unusual week does not distort the whole picture.
It is useful for firms that need a quick answer for cash planning, stock buying, or short-term staffing. UK businesses can also see how uneven retail demand can be in the Office for National Statistics retail sales releases, which is exactly the kind of variation this method smooths.
It works best when:
- You have consistent history: At least a year or two of comparable sales periods makes the output more useful.
- Demand is relatively steady: Repeatable patterns matter more than one-off big deals.
- You need something easy to explain: Owners, finance leads, and sales managers can all follow the logic.
Its limitation is speed. If demand shifts fast, moving average lags behind reality.
ARIMA and deeper time series work
ARIMA is a better fit when timing matters as much as volume. It is built for businesses with recurring patterns, such as seasonal retail, hospitality, or any operation where certain months behave differently from the rest of the year.
Used properly, ARIMA can separate trend from seasonal movement and random noise. That makes it more useful than a simple average when the business has enough clean history and the sales cycle is not too erratic.
The trade-off is practical, not theoretical. ARIMA needs structured time-series data, enough history to model patterns, and someone who can test whether the model is still behaving sensibly after a market change. For many SMEs, that used to put it out of reach. No-code AI automation changes that. Tools such as Zenfox.ai can help smaller teams run more advanced forecasting workflows without hiring a data science team, as long as the underlying data is clean enough to trust.
Regression analysis
Regression is the method I trust most when revenue clearly moves with a few known drivers. For a UK B2B service firm, that might be lead volume, win rate, average deal value, proposal-to-close time, or inbound enquiry source. For an ecommerce business, it could be traffic, conversion rate, promotions, and repeat purchase behaviour.
This method is often stronger than pure historical forecasting because it explains movement instead of only projecting it. If revenue is down, regression can show whether the problem sits in lead flow, conversion, pricing, or sales cycle drag.
It is also less forgiving of bad CRM habits. Missing close dates, inconsistent source tagging, and vague opportunity notes will weaken the model quickly.
Opportunity stage weighting
Stage weighting remains common because every CRM can do it and every sales team understands it. Multiply open pipeline by stage probability and you get a forecast.
That convenience is exactly why teams overuse it.
In small firms, stage weighting often turns into false confidence. Probabilities are copied from default CRM settings, stages are too broad, and stale deals sit in the forecast for weeks. A £40,000 proposal that has not moved in 45 days is not the same as a fresh proposal with a booked decision call, even if both sit in the same stage.
A weighted pipeline is useful for inspecting current deals. It is a weak method when used on its own.
For founder-led sales teams and SMEs, I would treat stage weighting as an operating view, not the final number presented to finance.
Sales Forecasting Methodology Comparison
| Methodology | Best For | Data Required | Complexity | Key Advantage |
|---|---|---|---|---|
| Opportunity stage weighting | Teams with a defined CRM pipeline | Current opportunities and stage probabilities | Low | Fast view of active deals |
| Moving average | Stable businesses with long sales history | Historical sales by period | Low | Smooths short-term variation |
| ARIMA time series | Seasonal businesses with strong recurring patterns | Structured time-series data over many periods | High | Separates trend from seasonality |
| Regression analysis | B2B teams with multiple performance drivers | CRM data plus business variables | Medium to high | Connects forecast to measurable drivers |
| Qualitative forecast | New products, founder-led sales, sparse data | Team judgement and market context | Low | Useful when hard data is limited |
A practical rule works better than academic purity:
- Use moving average for a baseline view.
- Use ARIMA if seasonality materially affects demand.
- Use regression when a few inputs clearly drive revenue.
- Use stage weighting to manage live pipeline activity, not to replace more specific forecasting.
- Use automation once manual updates start eating time or introducing errors.
That last point is where smaller UK businesses can now catch up. A few years ago, advanced forecasting was mostly an enterprise project. Now a solo consultant, a distributor, or a 25-person SaaS firm can combine CRM data, spreadsheet inputs, and no-code AI automation into a forecasting process that is good enough to run the business well. The method still matters. Clean inputs and consistent use matter just as much.
How to Choose the Right Forecasting Methodology
Organizations often choose a forecasting method backwards. They start with whatever their CRM offers, then call that a methodology.
A better approach starts with business context. The forecast should fit the company you are, not the company you might become later.

Start with business maturity
An early-stage consultant, agency, or startup usually lacks enough historical data for advanced time series work. In that case, the right answer is often a disciplined qualitative forecast with some pipeline structure.
An established SME with several years of repeatable demand should lean harder on historical methods. If there’s clear seasonality, time-based modelling becomes much more valuable.
A B2B SaaS team with a proper CRM, tracked conversions, and clear stages should move toward regression or hybrid models. That’s especially true when headline pipeline value says one thing but actual close behaviour keeps saying another.
Match the model to the sales motion
Your sales motion matters more than many teams realise.
If you sell a low-volume, high-trust service, rep judgement and deal-level review still matter a great deal. If you sell repeatable products with clear periodic patterns, history usually matters more than rep confidence. If your market reacts to external variables, pure historical methods will often lag.
Use this logic:
- Short cycle and simple offers: Stage weighting plus lead volume tracking can work.
- Long cycle and complex deals: Include sales cycle behaviour, stall risk, and rep judgement.
- Seasonal demand: Prioritise time-based methods.
- Externally driven markets: Add causal variables instead of relying on pipeline alone.
If your close dates move often, your forecast problem may be a sales process problem first.
Use a simple selection checklist
A practical choice usually comes down to these questions:
-
How much reliable history do you have?
No meaningful history points toward qualitative or pipeline-led methods. Strong history opens the door to moving average or time series. -
How structured is the CRM?
If stage data is weak, don’t over-trust stage-weighted forecasting. -
How stable is the market?
Stable markets reward historical models. Volatile ones need broader inputs. -
How complex is the sales cycle?
The longer and less linear the cycle, the less useful simplistic stage probabilities become. -
Who will maintain the model?
A slightly simpler model that gets updated consistently beats a clever model no one trusts.
A good sales forecasting methodology is usually hybrid. Small UK teams don’t need a data science department to build one, but they do need honesty about their data quality and selling reality. That’s where better forecasts start.
Measuring Success Key Forecasting Metrics and KPIs
A forecast isn’t good because it looks tidy in a dashboard. It’s good if it helps the business make better decisions and proves reliable over time.
That means measuring the forecast itself, not just admiring the output.
Forecast accuracy
Forecast accuracy is the most obvious metric. It compares what you predicted with what happened.
The formula matters less than the discipline behind it. Track it every cycle. Review it at the same level you forecast at: monthly, quarterly, by segment, or by rep if needed.
If your forecast keeps missing in the same direction, you don’t have a random issue. You have a systematic one.
Bias
Bias tells you whether the team tends to over-forecast or under-forecast.
This is one of the most useful metrics in practice because it exposes behaviour. Consistent over-forecasting usually means rep optimism, stage inflation, or pressure to present a stronger number. Consistent under-forecasting can mean sandbagging, fear of scrutiny, or poor visibility into late-stage acceleration.
Forecast bias is rarely a maths issue. It’s usually a management issue.
MAPE
MAPE, or Mean Absolute Percentage Error, is one of the cleaner ways to judge forecast quality because it measures average percentage error across periods.
It’s especially helpful when comparing methods. If you run a simple stage-weighted model and a regression model side by side, MAPE can show which one is closer to reality over time. One verified ARIMA implementation benchmark uses MAPE below 10% on holdout data as a validation target, which is a good reminder that serious models need disciplined evaluation, not just confidence in the setup.
Operational KPIs around the forecast
The forecast also affects operating outcomes, so measure the surrounding process too. Competitive context matters here as well, because close rates and deal movement often shift when rivals change pricing, messaging, or timing. Tracking that external movement is easier when the team has a repeatable process for competitive intelligence.
Useful supporting KPIs include:
- Pipeline coverage: Whether open pipeline is sufficient for the target period.
- Stage ageing: Whether deals are sitting too long in one stage.
- Close date movement: Whether expected revenue keeps slipping.
- Forecast cadence compliance: Whether updates happen on time and with evidence.
A practical review rhythm looks like this:
| KPI | What it reveals | What to do if it drifts |
|---|---|---|
| Accuracy | Overall reliability | Reassess method fit |
| Bias | Over- or under-confidence | Review rep and manager behaviour |
| MAPE | Comparative model quality | Test alternate models |
| Stage ageing | Pipeline health | Challenge stalled deals |
| Close date slippage | Timing realism | Tighten exit criteria for stages |
The goal isn’t perfect prediction. It’s dependable planning. Teams that measure these signals improve faster because they stop arguing about anecdotes and start fixing the mechanics.
Common Forecasting Pitfalls and How to Avoid Them
Forecasts usually fail for boring reasons. The pipeline is overstated, close dates are too generous, and the model assumes the next quarter will behave like the last one.
I see the same pattern in UK SMEs and solo-led firms. The owner knows the deals personally, so judgement starts to replace evidence. That can work while the pipeline is small. It breaks as soon as a few deals slip at once, one buyer freezes spending, or a regulated customer adds an extra approval step.
The familiar mistakes
These problems show up repeatedly:
- Optimism disguised as judgement: Reps or founders treat a positive call as purchase intent.
- Dirty CRM data: Stage, amount, and close date fields are out of date, so the forecast is wrong before the review starts.
- Ignoring sales cycle variation: Teams forecast all deals on the same timetable even when deal size, sector, and buyer type clearly change speed.
- Using one method for everything: A simple weighted pipeline gets applied to every segment, even when historical forecasting or regression would fit better.
Those issues are fixable. The harder problem is that many teams only look inward.
The overlooked risk in UK forecasting
UK forecasts get distorted by external pressure that never appears in a stage field. Regulatory reviews, hiring freezes, procurement controls, and weaker buyer confidence all slow deals that looked healthy a week earlier.
For firms selling into regulated sectors, the FCA Consumer Duty page is a better reference point than any secondary blog summary. For broader economic assumptions, use the Office for Budget Responsibility economic and fiscal outlook. Those are the sources finance teams and serious operators should work from.
This matters more for smaller UK businesses because they have less room for forecast error. A solo consultant or 20-person SaaS company cannot absorb three slipped deals the way an enterprise sales team can. One bad assumption can distort hiring, cash planning, and spend decisions for a full quarter.
A practical fix is to separate what the pipeline says from what the market is doing.
- Review external signals in every forecast call: Check sector regulation, buyer sentiment, and economic conditions alongside deal movement.
- Apply different assumptions by segment: Public sector, financial services, and early-stage startups do not close on the same pattern.
- Treat repeated slippage as a signal: If delays cluster in one industry or deal type, change the forecast logic instead of blaming rep execution.
- Automate signal capture: A system like the Zenfox autonomy engine for sales workflow automation can pull current activity and supporting context into the forecast without adding admin work.
The teams that improve forecasting stop treating misses as isolated mistakes. They look for system errors. In practice, that means cleaner deal criteria, segment-specific assumptions, and automated updates that keep the model tied to current reality instead of last week's CRM snapshot.
Automating Your Forecasts with AI and Zenfox
Friday afternoon is when weak forecasting systems usually break. A deal slips, a buyer goes quiet, someone mentions budget pressure in Slack, and the number in the spreadsheet still looks fine because nobody has updated it yet.
That gap hurts smaller UK businesses more than anyone else. A solo consultant, agency owner, or 25-person SaaS team cannot afford to wait until the weekly forecast call to find out that next month’s revenue changed three days ago. The problem is rarely the forecasting formula on its own. The problem is stale inputs, scattered signals, and too much manual cleanup.

Where automation helps
AI earns its place in forecasting when it removes delay and inconsistency from the process.
A good automation layer can pull deal changes from HubSpot, pick up buying signals from Gmail and Slack, standardise messy fields, and refresh the forecast without waiting for a rep to log every update perfectly. That matters because forecast quality is tied to update speed. If the system is a week behind reality, the model is wrong even if the maths is sound.
For solo professionals and SMEs, this is the shift. They can run a forecasting process that looks far more mature than their headcount would suggest, without hiring an analyst or building a data pipeline from scratch. No-code automation closes that gap.
I have seen small teams overcomplicate this part. They go looking for advanced AI before they fix data movement. Start with the boring work that machines are better at: syncing activity, flagging missing fields, spotting sudden inactivity, and updating confidence rules when conditions change. Those are the jobs that improve the forecast.
A modern autonomy engine for sales workflow automation matters because the forecast should not sit in a dashboard waiting for someone to notice it. It should push updates to the team, trigger follow-up tasks, and surface risk while there is still time to act.
What modern forecasting should look like
A useful AI-supported setup does three things well:
- Ingest context automatically: Pull data from CRM, email, internal chat, and the operating signals your team already uses.
- Update continuously: Recalculate when buyer behaviour changes, not only on forecast-call day.
- Turn the forecast into action: Flag variance, route alerts, and prompt the next step for the owner of the deal.
This is worth seeing in action:
That operating model used to be reserved for larger companies with RevOps staff, analysts, and custom reporting. It is now accessible to UK small businesses that need better forecasting but do not have time for another manual process.
The teams that get this right do not chase the most complex model. They build a clean loop between signal, forecast, and action, then let automation keep that loop current.
Zenfox.ai helps solo professionals and small teams automate that loop. If you want forecasting that updates from the tools you already use, including HubSpot, Gmail, and Slack, explore Zenfox.ai.